这篇教程matplotlib之pyplot模块坐标轴范围设置(autoscale(),xlim(),ylim())写得很实用,希望能帮到您。
matplotlib默认根据数据系列自动缩放坐标轴范围。pyplot模块中的autoscale函数可以切换是否自动缩放坐标轴范围,xlim()和ylim()函数可手动设置坐标轴范围。
autoscale函数对于pyplot模块控制坐标轴范围是否自动缩放的函数为autoscale。
函数签名为matplotlib.pyplot.autoscale(enable=True, axis='both', tight=None)
参数作用及取值如下: enable为布尔值,即是否自动缩放。axis取值范围为{'both', 'x', 'y'},默认值为'both',即作用在哪个坐标轴。tight为布尔值,默认值为None,即是否设置边距为0。 底层相关函数有: - Axes.autoscale
- Axes.autoscale_view
- Axes.set_autoscale_on
- Axes.get_autoscale_on
- Axes.set_autoscalex_on
- Axes.get_autoscalex_on
- Axes.set_autoscaley_on
- Axes.get_autoscaley_on
案例自动缩放坐标轴范围功能对比。 import matplotlib.pyplot as pltplt.subplot(121)plt.plot([0.5,0.5])print(plt.gca().get_autoscale_on())print(plt.gca().get_autoscalex_on())print(plt.gca().get_autoscaley_on())plt.subplot(122)plt.plot([0.5,0.5])plt.autoscale(False)print(plt.gca().get_autoscale_on())print(plt.gca().get_autoscalex_on())print(plt.gca().get_autoscaley_on())plt.show() 输出:
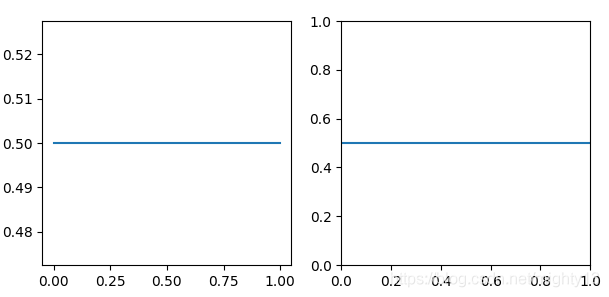
True
True
True
False
False
False
xlim()函数手动设置x坐标轴的范围或获取x坐标轴的范围。 函数签名为matplotlib.pyplot.xlim(*args, **kwargs)。 调用签名有三种: xlim((left, right))xlim(left, right)xlim(left=1, right=3) 其中left为x坐标轴左侧极值,right为x坐标轴右侧极值。注意!left可以比right大! 返回值为(left, right),即坐标轴范围元组。 xlim()相当于Axes.get_xlim,xlim(*args, **kwargs)相当于Axes.set_xlim。
案例演示xlim()的调用方法。 import matplotlib.pyplot as pltplt.figure(figsize=(14, 3))plt.subplot(141)plt.plot([1, 1])print(plt.xlim())plt.subplot(142)plt.plot([1, 1])plt.xlim(0, 1.5)plt.annotate('plt.xlim(0,1.5)', (0.1, 1.001))print(plt.xlim())plt.subplot(143)plt.plot([1, 1])plt.xlim((0, 1.5))plt.annotate('plt.xlim((0,1.5))', (0.1, 1.001))print(plt.xlim())plt.subplot(144)plt.plot([1, 1])plt.xlim(left=0, right=1.5)plt.annotate('plt.xlim(left=0,right=1.5)', (0.1, 1.001))print(plt.xlim())plt.show()输出:
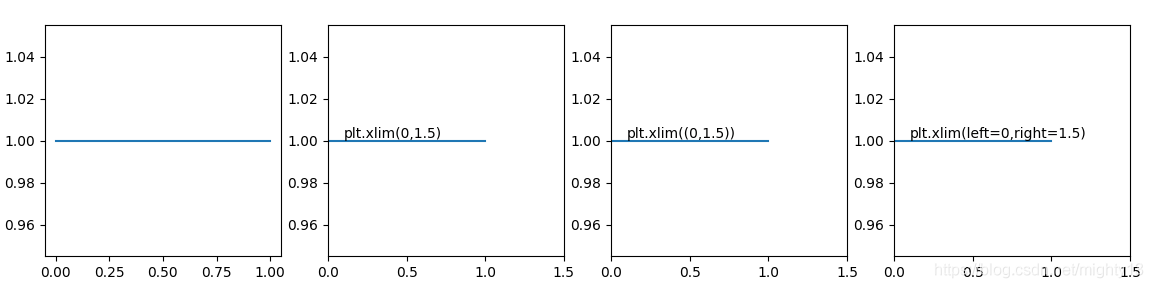
(-0.05, 1.05)
(0.0, 1.5)
(0.0, 1.5)
(0.0, 1.5)
ylim()函数手动设置y坐标轴的范围或获取y坐标轴的范围。使用方法与xim()函数相似。 函数签名为matplotlib.pyplot.ylim(*args, **kwargs)。 调用签名有三种: ylim((bottom, top))ylim(bottom, top)ylim(bottom=1, top=3) 其中bottom为x坐标轴左侧极值,top为x坐标轴右侧极值。注意!bottom可以比top大! 返回值为(bottom, top),即坐标轴范围元组。 ylim()相当于Axes.get_ylim,ylim(*args, **kwargs)相当于Axes.set_ylim。
案例演示ylim()的调用方法。 import matplotlib.pyplot as pltplt.figure(figsize=(14, 3))plt.subplot(141)plt.plot([1, 1])print(plt.ylim())plt.subplot(142)plt.plot([1, 1])plt.ylim(0, 1.5)plt.annotate('plt.ylim(0,1.5)', (0.1, 1.01))print(plt.ylim(0,1.5))plt.subplot(143)plt.plot([1, 1])plt.ylim((0, 1.5))plt.annotate('plt.ylim((0,1.5))', (0.1, 1.01))print(plt.ylim())plt.subplot(144)plt.plot([1, 1])plt.ylim(bottom=0, top=1.5)plt.annotate('plt.ylim(bottom=0,top=1.5)', (0.1, 1.01))print(plt.ylim())plt.show()输出:
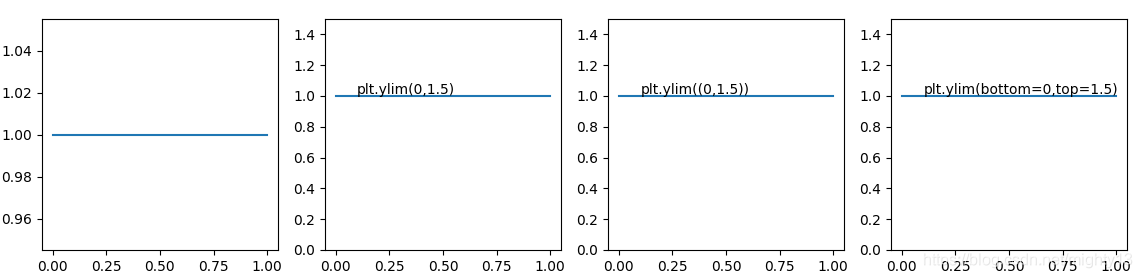
(0.945, 1.0550000000000002)
(0.0, 1.5)
(0.0, 1.5)
(0.0, 1.5)
到此这篇关于matplotlib之pyplot模块坐标轴范围设置(autoscale(),xlim(),ylim())的文章就介绍到这了,更多相关matplotlib 坐标轴范围内容请搜索51zixue.net以前的文章或继续浏览下面的相关文章希望大家以后多多支持51zixue.net!
Python画笔的属性及用法详解
浅谈python中的@以及@在tensorflow中的作用说明 |


