这篇教程Matplotlib animation模块实现动态图写得很实用,希望能帮到您。
matplotlib 画图功能非常强大,目前也只能根据官网 提供的例子简单地画几张图。最近学习了能画动态图的animation模块,作个简单地记录。 在matplotlib作图中,比较常用的是matplotlib.pyplot模块,这个模块有非常多的属性和方法,简要列举下这次用到的方法:
matplotlib.pyplot.subplots(nrows=1, ncols=1, sharex=False, sharey=False, squeeze=True, subplot_kw=None, gridspec_kw=None, **fig_kw)
返回fig和ax对象!
例子1. 动态画出sin函数曲线import numpy as npimport matplotlib.pyplot as pltfrom matplotlib.animation import FuncAnimationfig, ax = plt.subplots()xdata, ydata = [], []ln, = ax.plot([], [], 'r-', animated=False)def init(): ax.set_xlim(0, 2*np.pi) ax.set_ylim(-1, 1) return ln,def update(frame): xdata.append(frame) ydata.append(np.sin(frame)) ln.set_data(xdata, ydata) return ln,ani = FuncAnimation(fig, update, frames=np.linspace(0, 2*np.pi, 128), init_func=init, blit=True)plt.show() 
画这类图的关键是要给出不断更新的函数,这里就是update 函数了。注意, line, = ax.plot([], [], 'r-', animated=False) 中的, 表示创建tuple类型。迭代更新的数据frame 取值从frames 取得。 例子2. 动态显示一个动点,它的轨迹是sin函数。import numpy as np import matplotlib.pyplot as pltfrom matplotlib import animation"""animation example 2author: Kiterun"""fig, ax = plt.subplots()x = np.linspace(0, 2*np.pi, 200)y = np.sin(x)l = ax.plot(x, y)dot, = ax.plot([], [], 'ro')def init(): ax.set_xlim(0, 2*np.pi) ax.set_ylim(-1, 1) return ldef gen_dot(): for i in np.linspace(0, 2*np.pi, 200): newdot = [i, np.sin(i)] yield newdotdef update_dot(newd): dot.set_data(newd[0], newd[1]) return dot,ani = animation.FuncAnimation(fig, update_dot, frames = gen_dot, interval = 100, init_func=init)ani.save('sin_dot.gif', writer='imagemagick', fps=30)plt.show()这里我们把生成的动态图保存为gif图片,前提要预先安装imagemagic。
例子3. 单摆(没阻尼&有阻尼)无阻尼的单摆力学公式:
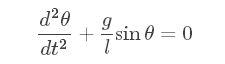
附加阻尼项:

这里需要用到scipy.integrate的odeint模块,具体用法找时间再专门写一篇blog吧,动态图代码如下: # -*- coding: utf-8 -*-from math import sin, cosimport numpy as npfrom scipy.integrate import odeintimport matplotlib.pyplot as pltimport matplotlib.animation as animationg = 9.8leng = 1.0b_const = 0.2# no decay case:def pendulum_equations1(w, t, l): th, v = w dth = v dv = - g/l * sin(th) return dth, dv# the decay exist case:def pendulum_equations2(w, t, l, b): th, v = w dth = v dv = -b/l * v - g/l * sin(th) return dth, dvt = np.arange(0, 20, 0.1)track = odeint(pendulum_equations1, (1.0, 0), t, args=(leng,))#track = odeint(pendulum_equations2, (1.0, 0), t, args=(leng, b_const))xdata = [leng*sin(track[i, 0]) for i in range(len(track))]ydata = [-leng*cos(track[i, 0]) for i in range(len(track))]fig, ax = plt.subplots()ax.grid()line, = ax.plot([], [], 'o-', lw=2)time_template = 'time = %.1fs'time_text = ax.text(0.05, 0.9, '', transform=ax.transAxes)def init(): ax.set_xlim(-2, 2) ax.set_ylim(-2, 2) time_text.set_text('') return line, time_textdef update(i): newx = [0, xdata[i]] newy = [0, ydata[i]] line.set_data(newx, newy) time_text.set_text(time_template %(0.1*i)) return line, time_textani = animation.FuncAnimation(fig, update, range(1, len(xdata)), init_func=init, interval=50)#ani.save('single_pendulum_decay.gif', writer='imagemagick', fps=100)ani.save('single_pendulum_nodecay.gif', writer='imagemagick', fps=100)plt.show()
例子4. 滚动的球import numpy as np import matplotlib.pyplot as plt import matplotlib.animation as animationfig = plt.figure(figsize=(6, 6))ax = plt.gca()ax.grid()ln1, = ax.plot([], [], '-', lw=2)ln2, = ax.plot([], [], '-', color='r', lw=2)theta = np.linspace(0, 2*np.pi, 100)r_out = 1r_in = 0.5def init(): ax.set_xlim(-2, 2) ax.set_ylim(-2, 2) x_out = [r_out*np.cos(theta[i]) for i in range(len(theta))] y_out = [r_out*np.sin(theta[i]) for i in range(len(theta))] ln1.set_data(x_out, y_out) return ln1,def update(i): x_in = [(r_out-r_in)*np.cos(theta[i])+r_in*np.cos(theta[j]) for j in range(len(theta))] y_in = [(r_out-r_in)*np.sin(theta[i])+r_in*np.sin(theta[j]) for j in range(len(theta))] ln2.set_data(x_in, y_in) return ln2,ani = animation.FuncAnimation(fig, update, range(len(theta)), init_func=init, interval=30)ani.save('roll.gif', writer='imagemagick', fps=100)plt.show()
到此这篇关于Matplotlib animation模块实现动态图 的文章就介绍到这了,更多相关Matplotlib 动态图 内容请搜索51zixue.net以前的文章或继续浏览下面的相关文章希望大家以后多多支持51zixue.net!
python连接手机自动搜集蚂蚁森林能量的实现代码
python中if嵌套命令实例讲解 |


