这篇教程Python 数据可视化之Bokeh详解写得很实用,希望能帮到您。
安装要安装此类型,请在终端中输入以下命令。 pip install bokeh
散点图散点图中散景可以使用绘图模块的散射()方法被绘制。这里分别传递 x 和 y 坐标。 例子: # 导入模块from bokeh.plotting import figure, output_file, showfrom bokeh.palettes import magmaimport pandas as pd# 实例化图形对象graph = figure(title = "Bokeh Scatter Graph")# 读取数据库data = pd.read_csv("tips.csv")color = magma(256)# 绘制图形graph.scatter(data['total_bill'], data['tip'], color=color)# 展示模型show(graph)输出: 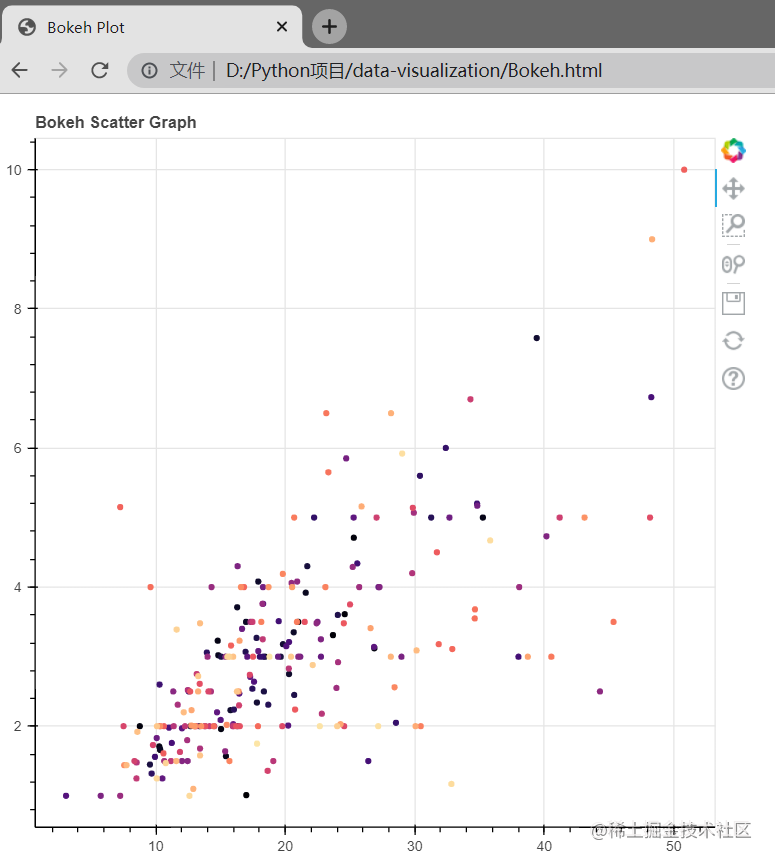
折线图例子: # 导入模块from bokeh.plotting import figure, output_file, showimport pandas as pd# 实例化图形对象graph = figure(title = "Bokeh Bar Chart")# 读取数据库data = pd.read_csv("tips.csv")# 提示列的每个唯一值的计数df = data['tip'].value_counts()# 绘制图形graph.line(df, data['tip'])# 展示模型show(graph)输出: 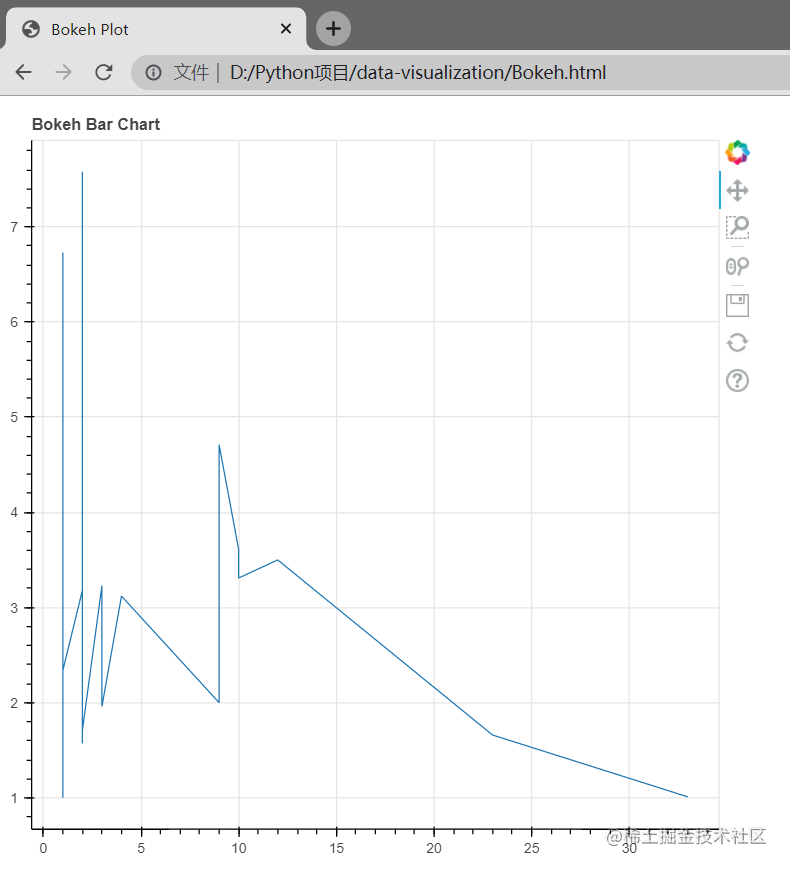
条形图条形图可以有水平条和垂直条两种类型。 每个都可以分别使用绘图界面的 hbar() 和 vbar() 函数创建。 例子: # 导入模块from bokeh.plotting import figure, output_file, showimport pandas as pd# 实例化图形对象graph = figure(title = "Bokeh Bar Chart")# 读取数据库data = pd.read_csv("tips.csv")# 绘制图形graph.vbar(data['total_bill'], top=data['tip'])# 展示模型show(graph)输出: 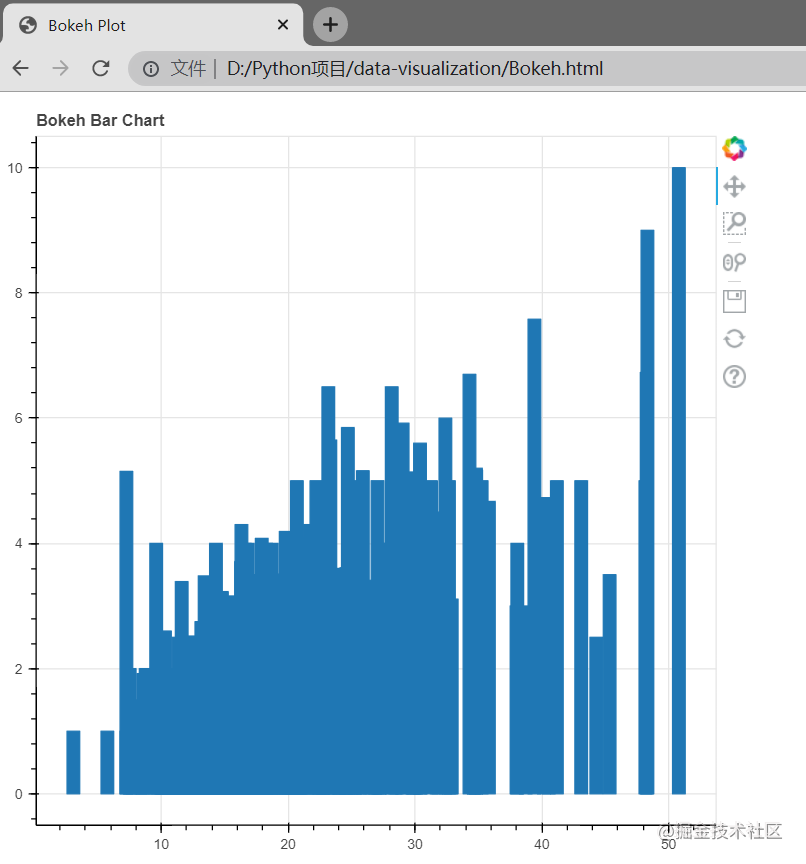
交互式数据可视化Bokeh 的主要功能之一是为绘图添加交互性。 让我们看看可以添加的各种交互。
Interactive Legendsclick_policy 属性使图例具有交互性。 有两种类型的交互
- 隐藏:隐藏字形。
- 静音:隐藏字形使其完全消失,另一方面,静音字形只是根据参数去强调字形。
例子: # 导入模块from bokeh.plotting import figure, output_file, showimport pandas as pd# 实例化图形对象graph = figure(title = "Bokeh Bar Chart")# 读取数据库data = pd.read_csv("tips.csv")# 绘制图形graph.vbar(data['total_bill'], top=data['tip'], legend_label = "Bill VS Tips", color='green')graph.vbar(data['tip'], top=data['size'], legend_label = "Tips VS Size", color='red')graph.legend.click_policy = "hide"# 展示模型show(graph)输出: 
添加小部件Bokeh 提供了类似于 HTML 表单的 GUI 功能,如按钮、滑块、复选框等。这些为绘图提供了一个交互界面,允许更改绘图参数、修改绘图数据等。让我们看看如何使用和添加一些常用的小部件。
按钮这个小部件向绘图添加了一个简单的按钮小部件。 我们必须将自定义 JavaScript 函数传递给模型类的 CustomJS() 方法。
复选框向图中添加标准复选框。与按钮类似,我们必须将自定义 JavaScript 函数传递给模型类的 CustomJS() 方法。
单选按钮添加一个简单的单选按钮并接受自定义 JavaScript 函数。 例子: from bokeh.io import showfrom bokeh.models import Button, CheckboxGroup, RadioGroup, CustomJSbutton = Button(label="GFG")button.js_on_click(CustomJS( code="console.log('button: click!', this.toString())"))# 复选框和单选按钮的标签L = ["First", "Second", "Third"]# 活动参数集默认检查选定的值checkbox_group = CheckboxGroup(labels=L, active=[0, 2])checkbox_group.js_on_click(CustomJS(code=""" console.log('checkbox_group: active=' + this.active, this.toString())"""))# 活动参数集默认检查选定的值radio_group = RadioGroup(labels=L, active=1)radio_group.js_on_click(CustomJS(code=""" console.log('radio_group: active=' + this.active, this.toString())"""))show(button)show(checkbox_group)show(radio_group)输出: 


注意: 所有这些按钮都将在新选项卡上打开。 滑块: 向绘图添加一个滑块。 它还需要一个自定义的 JavaScript 函数。 示例: from bokeh.io import showfrom bokeh.models import CustomJS, Sliderslider = Slider(start=1, end=20, value=1, step=2, title="Slider")slider.js_on_change("value", CustomJS(code=""" console.log('slider: value=' + this.value, this.toString())"""))show(slider)输出: 
同样,更多的小部件可用,如下拉菜单或选项卡小部件可以添加。 下一节我们继续谈第四个库
Python 数据可视化之Matplotlib详解
Python 正则模块详情 |


